


Aquaculture Monitoring and Management System
Watch every pond, automate aeration and feeding, and run each culture cycle from stocking to harvest, from one platform and one mobile app.
From Pond Conditions to Profit per Pond
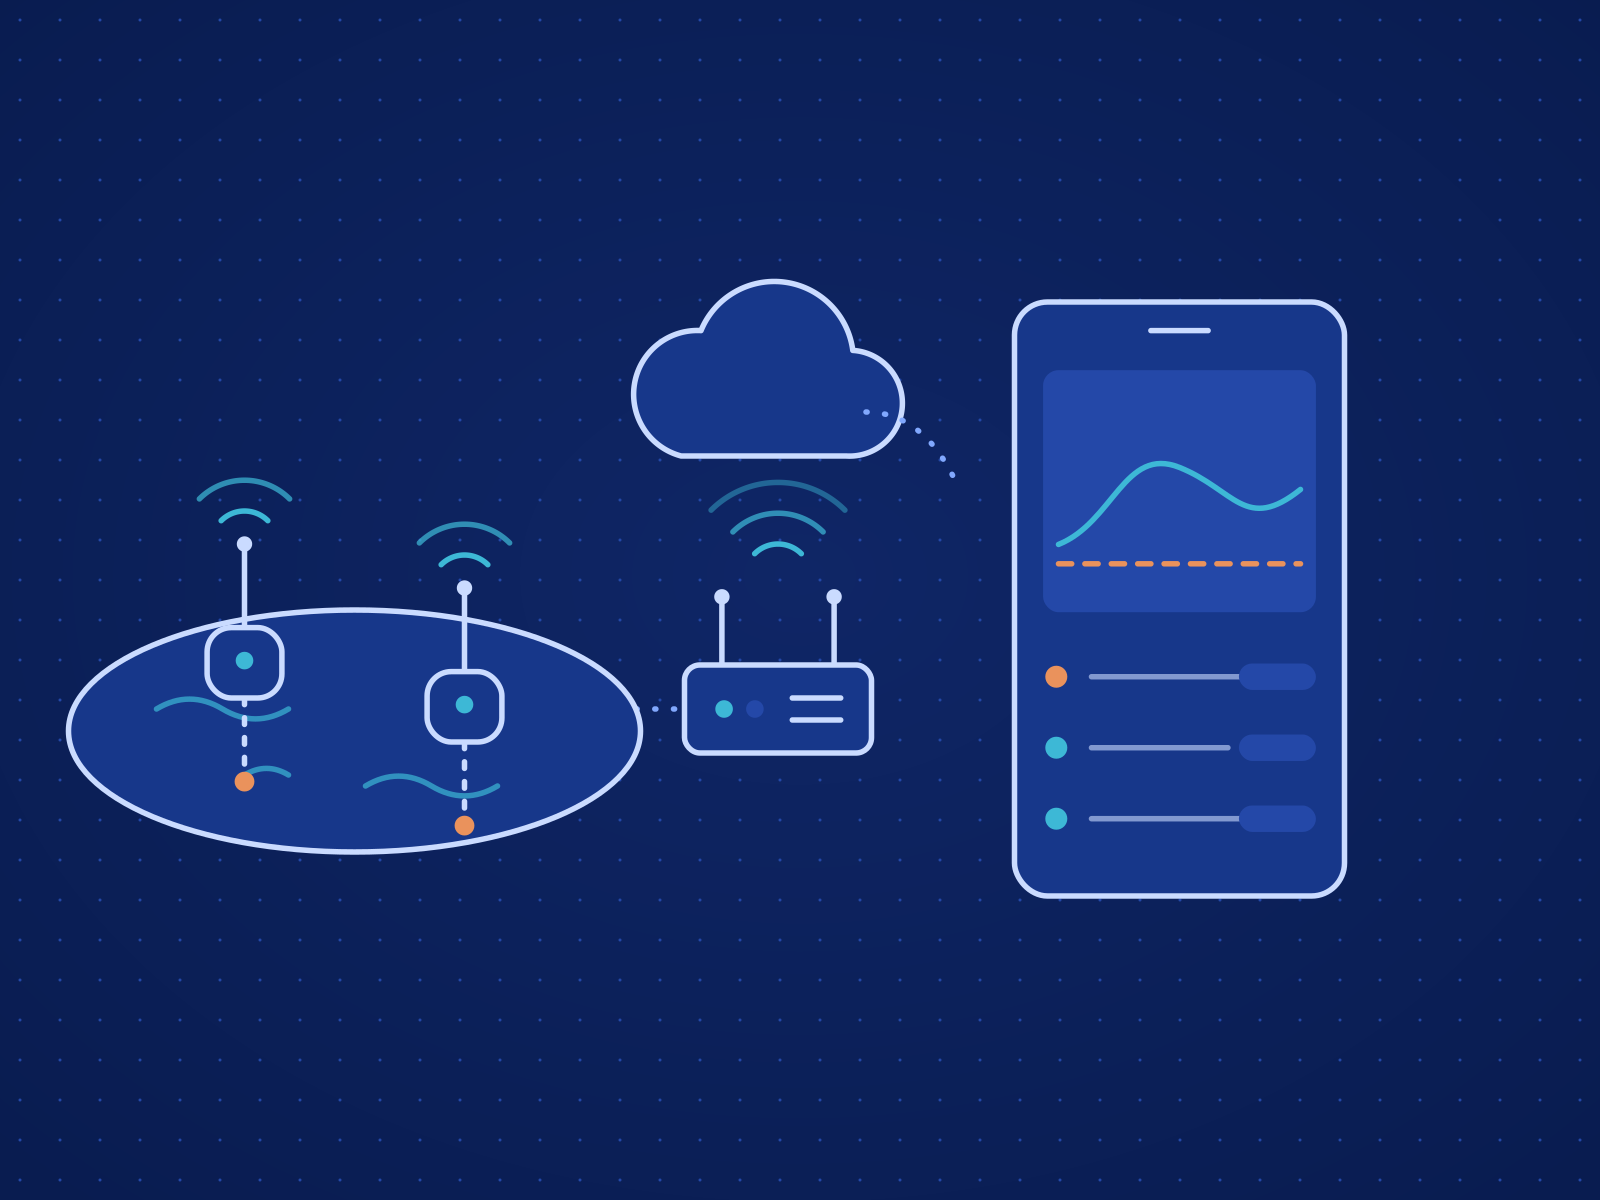
On a fish or shrimp farm, pond conditions can change overnight, and a problem noticed late can put a culture cycle at risk. The system brings IoT sensors, automated aerators and feeders, pond cameras, AI analytics and a mobile app together, so farmers see conditions as they change, are alerted before a problem spreads, and automate aeration and feeding. Each culture cycle is tracked from stocking to harvest, including what it costs and what it earns.
How Aquaculture Monitoring and Management System Works
The screens your team works in each day, and what each one is for.
| Time | Feed | Plan, kg | Fed, kg | Tray check | Status |
|---|---|---|---|---|---|
| 06:30 | Grower 2 mm | 4.4 | 4.4 | Empty | Done |
| 10:30 | Grower 2 mm | 4.6 | 4.6 | Little left | Done |
| 14:30 | Grower 2 mm | 4.6 | 4.6 | Some left | Done |
| 18:30 | Grower 2 mm | 4.8 | 4.3 | — | Adjusted |
| 22:30 | Grower 2 mm | 4.4 | — | — | Planned |
| When | Source | Observation | Flag |
|---|---|---|---|
| 05:40 | Camera C-08 | Surface swimming at pond edge, 30 min | Activity |
| 05:30 | Water | NH₃ 0.62 mg/L, above 0.5 limit | Ammonia |
| Sat 18:30 | Feeding | Leftover on tray 3 after two feeds | Feeding |
| Sat 07:15 | Mortality | 14 dead counted at the sluice | Logged |
| Sat 07:00 | Sampling | ABW 13.8 g from 50 animals, cast net | Logged |
| Fri 16:10 | Lab | Water and animal samples sent to lab | Pending |
| Pond | Kg | Costs | Per kg | Revenue | Profit | Status |
|---|---|---|---|---|---|---|
| P-01 Shrimp | 4,820 | 15,230 | 3.16 | 26,030 | 10,800 | Harvested |
| P-02 Shrimp | 4,400 | 12,980 | 2.95 | 23,760 | 10,780 | Growing |
| P-03 Tilapia | 6,100 | 8,420 | 1.38 | 11,590 | 3,170 | Growing |
| P-04 Shrimp | 3,900 | 12,640 | 3.24 | 21,060 | 8,420 | Growing |
| P-05 Shrimp | 4,150 | 13,110 | 3.16 | 22,410 | 9,300 | Growing |
| P-06 Tilapia | 5,760 | 8,050 | 1.40 | 10,940 | 2,890 | Harvested |
| P-07 Shrimp | 3,600 | 13,480 | 3.74 | 19,440 | 5,960 | High cost |
| P-08 Shrimp | 3,200 | 12,950 | 4.05 | 17,280 | 4,330 | High cost |
| All ponds | 35,930 | 96,860 | 2.70 | 152,510 | 55,650 |
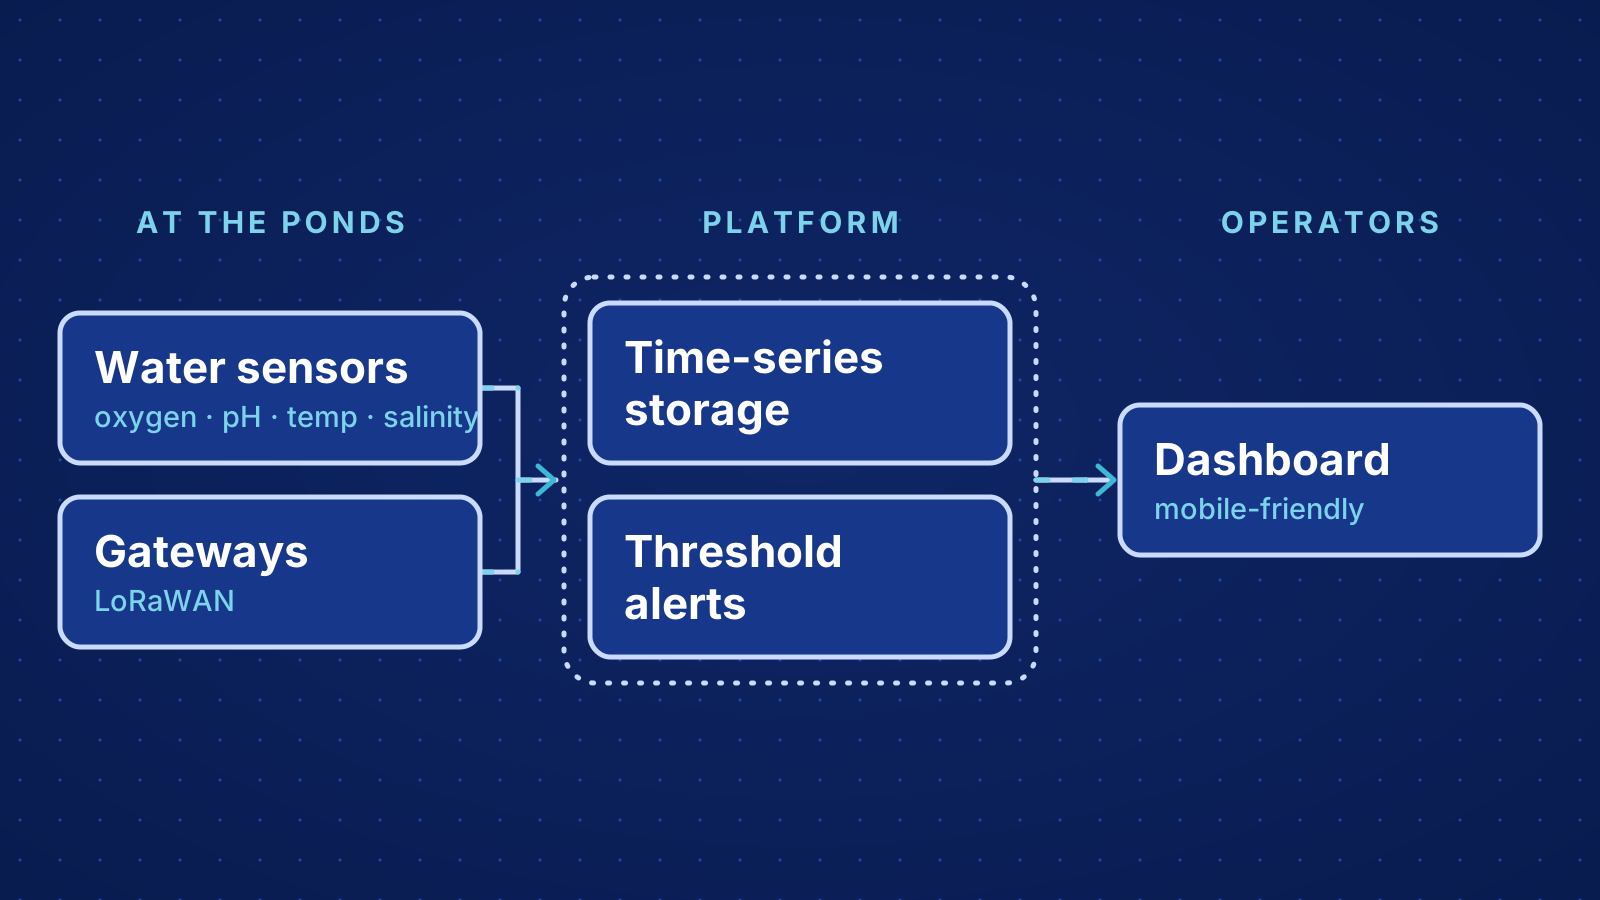
Dissolved oxygen, pH, temperature, salinity, ammonia and turbidity from sensors in each pond, with historical trends and alerts at thresholds the farm sets.
Also in Aquaculture Monitoring and Management System
Predictive Analytics & Weather
Forecasts of dissolved-oxygen fluctuation and of environmental and disease risk, estimates of growth, biomass and harvest timing, and weather forecasts with rainfall risk alerts.
Water Management
Water exchange recommendations, inlet and outlet monitoring, historical comparisons, and integration with automated pumps and other water equipment.
Farm, Pond & Harvest Records
Records across multiple farms and ponds: stocking, species and culture cycles, survival rate, feed conversion ratio (FCR), and forecast against actual harvests.
Mobile App, Alerts & Devices
A mobile app and web dashboard with live pond views, push and SMS alerts, daily to monthly reports, and health monitoring for sensors and equipment, with failure alerts.
Quoted Per Deployment
Aquaculture Monitoring and Management System is priced to the scope of each deployment: sites, devices, integrations and the support you need.
Quote for Aquaculture Monitoring and Management System
Tell us how many sites and devices you operate and which systems it must connect to, and we will return a scoped quote.
Related Case Studies
Aquaculture IoT Monitoring & Telemetry Platform
Pond sensors, gateways, dashboards and automation that monitor water quality and run aerators and feeders from one platform.