


Built by KoderTroop · Smart Infrastructure

Smart Streetlight Management and Smart Metering Platform

Control street lighting, read meters and track energy use across a city or campus from one platform, with a mobile app for field teams.
Smart Streetlight Management and Smart Metering Platform screen
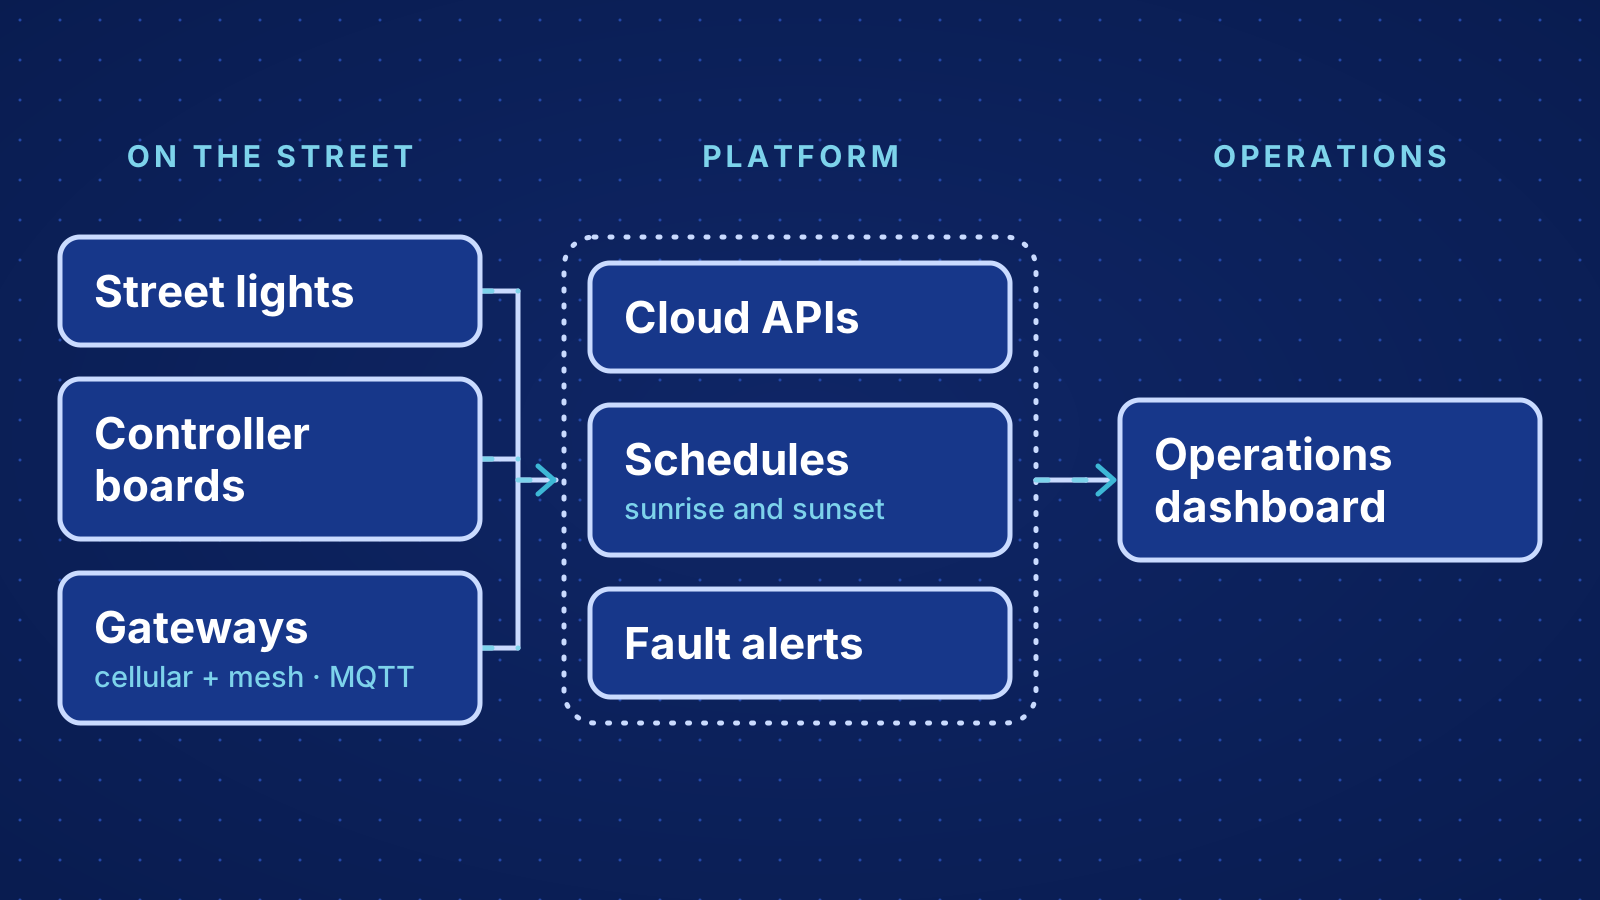
System diagram for Lighting, Metering and Feeders on One Map

Lighting, Metering and Feeders on One Map

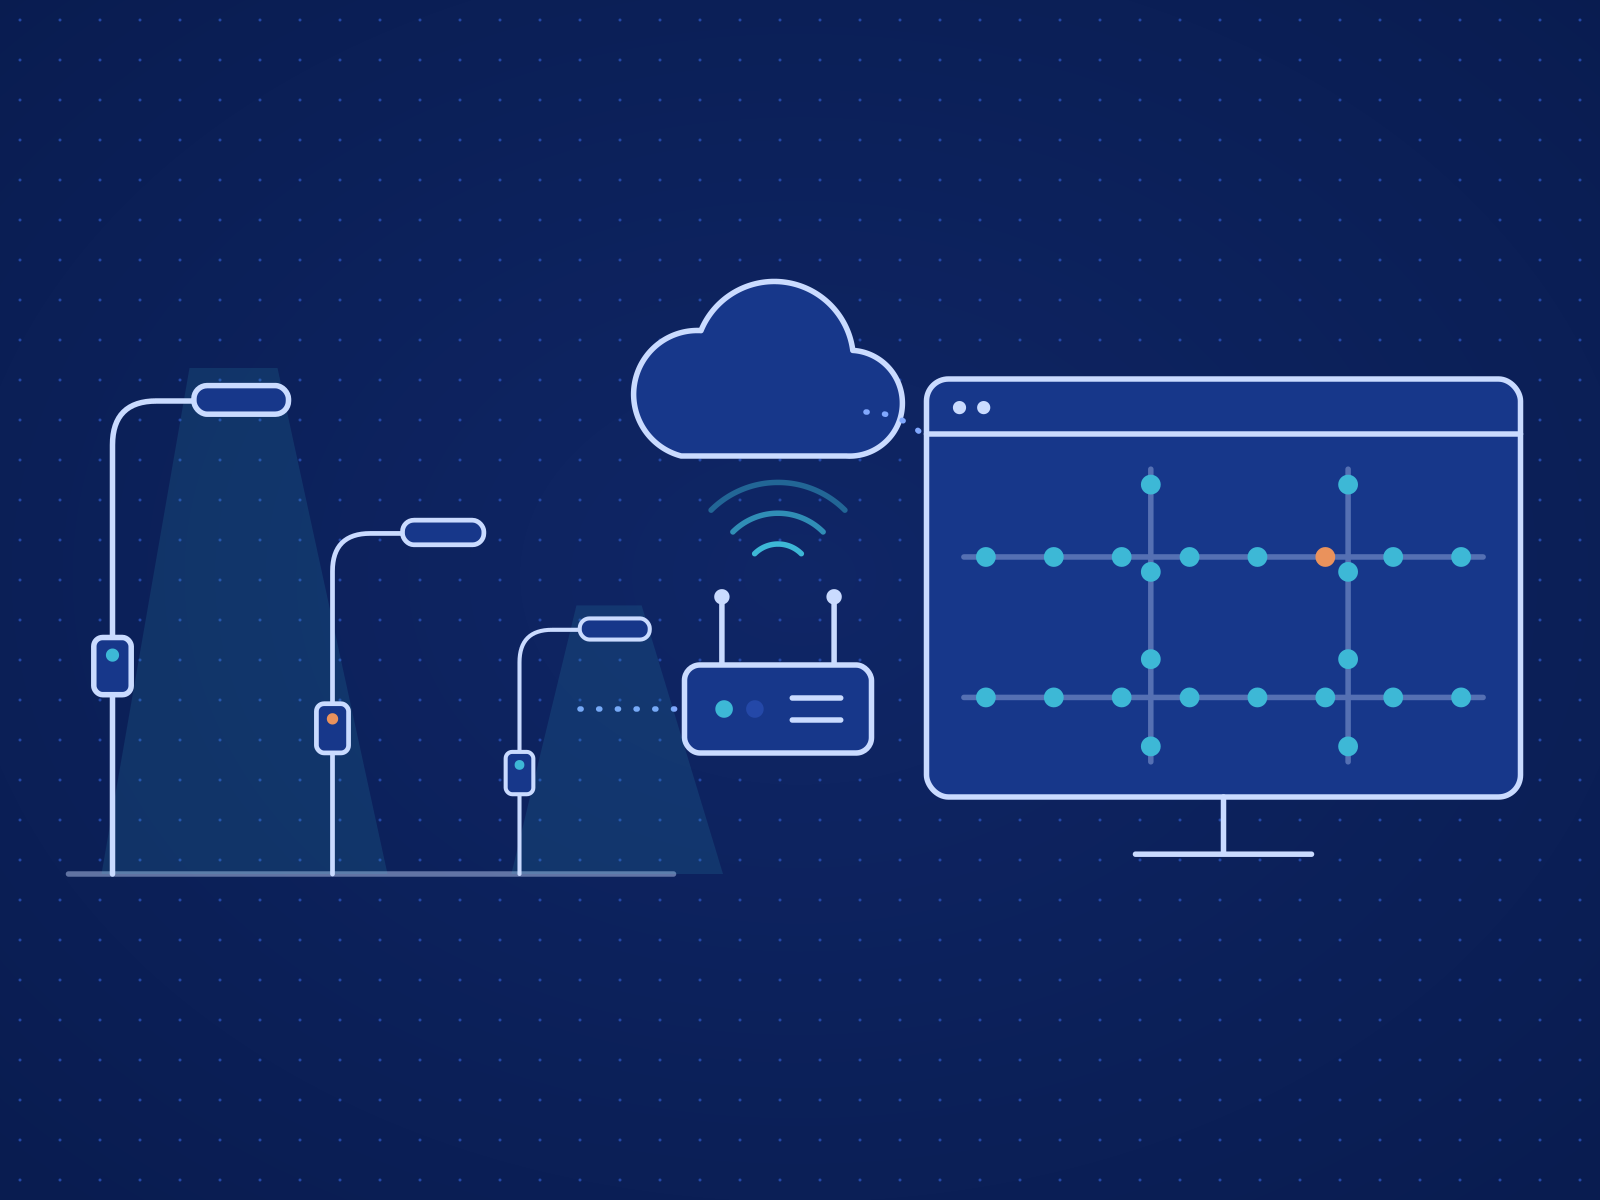
Run by patrol, a lighting network leaves failed lamps waiting for a complaint and energy use unclear until the bill arrives. The platform connects streetlight controllers, smart meters and feeders to a central system through IoT gateways. Operators see every light on a GIS map, switch lights remotely or on schedule, dim compatible fixtures, read meters automatically and see energy use by light, feeder and zone. Faults raise alerts and become work orders that field teams close from the mobile app.

How Smart Streetlight Management and Smart Metering Platform Works

The screens your team works in each day, and what each one is for.

Adaptive lighting · Residential streets
Zone C and Zone D · dusk-to-dawn profile with sensor overrides
WeekdayWeekendFestivalPublish profileEO
Dimming profiles
Residential streets
Zone C, Zone D · 412 lights
Arterial roads
FDR-03, FDR-07 · 286 lights
Park paths
Zone F · 64 lights
Market area
Zone B · 138 lights
Underpasses
Fixed 100% · 22 lights
Fixtures in profile
Dimmable (DALI, 0–10 V)396
Switch only16
Switch-only fixtures follow the on and off times; dimming steps apply to compatible fixtures.
Dimming level by hourProfileAverage actual, last night
0%50%100%10018:0010019:0010020:009021:008022:006023:005000:004001:004002:004003:005004:007005:0010006:00
On 17:58 · lux below 35Off 06:41 · lux above 55Motion boosts last night 37
Sensor rulesActive
Ambient light
On below 35 lux, off above 55 lux
Motion / occupancy
Raise to 100% for 90 s, then fade back
Traffic
Above 20 vehicles/min, hold at least 80%
Floor level
Never below 30% from dusk to dawn
Sensor events, tonight
TimeLightTriggerLevel
01:14SL-04127Motion40 → 100%
01:12SL-04131Motion40 → 100%
01:09SL-04188Traffic40 → 80%
01:02SL-04140Boost end100 → 40%
00:57SL-04127Motion40 → 100%
00:30Zone CStep50 → 40%
Energy and cost · October
All zones · time-of-day tariff T-2 · meter readings validated to 31 Oct
LightFeederZoneMonthly reportEO
Consumption
48,920 kWh
September 51,300 kWh
Actual cost
314,750
Estimated 317,990
Dimmed hours
41,820 h
lights below full output
Average power factor
0.94
Lowest FDR-09 at 0.86
Maximum demand
212 kVA
14 Oct, 18:40
Daily consumption, kWh1–31 Oct · all feeders
17142128
Estimated vs actual cost by feeder
FeederLightskWhEstimatedActualVariance
FDR-032129,84063,96062,880−1,080
FDR-071748,21053,37052,460−910
FDR-091187,46048,49049,820+1,330
FDR-1223611,38073,97072,720−1,250
FDR-141426,72043,68042,940−740
FDR-18965,31034,52033,930−590
Tariff T-2Edit
Off-peak22:00–06:005.40 / kWh
Normal06:00–18:006.20 / kWh
Peak18:00–22:007.80 / kWh
Demand chargeper kVA, monthly110.00
Consumption by zone
Zone A7,120 kWh
Zone B9,860 kWh
Zone C11,240 kWh
Zone D8,430 kWh
Zone E6,980 kWh
Zone F5,290 kWh
Faults and predictive maintenance
Lights, controllers, meters and feeders · health model updated 02:00
Light, meter or feeder IDCreate work orders (2)EO
Lamp out
7
+2 tonight
Comm loss
3
controllers
Power cut
1
restored
Abnormal V/I
4
2 feeders
Meter fault
2
CT, display
Excess use
2
2 meters
Predicted failures, next 30 daysRanked by likelihood
AssetComponentSignalLikelihoodRecommended
SL-04127LED driverCurrent +0.05 A in 21 daysHighReplace driver
CTL-0912Controller6 reconnects in 48 hHighCheck radio
SL-04133Lamp41,200 of 50,000 hMediumNov lamp batch
SL-02218PhotocellTurns on at 62 luxMediumRecalibrate
MTR-20417MeterL2 voltage drops to 0 VMediumCheck CT wiring
Live faults18 open
21:42SL-04155Lamp failure, current 0.02 AWO-31842
21:30CTL-0907Controller communication lostNew
21:12FDR-09Abnormal voltage, 262 V on phase RWatching
20:58MTR-20388Excessive consumption, 3.1× night baselineNew
SL-04127 · equipment healthDegrading
54/ 100 health scorewas 71 on 1 Nov
LED driver current, A · last 30 days
Replace above 0.48 A16 Oct1 Nov15 Nov
Burn hours28,400 / 50,000 h
Driver temperature64 °C · limit 75
Feeder · zoneFDR-12 · Zone C
Fixture90 W LED, dimmable
Last serviceWO-29107 · 14 Mar
Recommendation

Replace the LED driver on the next Zone C patrol. Hold the light at 80% until then to slow the drift.

Feeder network · Ward 3
Poles, feeder pillars and meters on the map · Zone C and Zone D
LightsFeedersMetersRegister poleEO
Zone CZone DSL-04127FP-3 · MTR-20417FP-5
Ward 3 · feeders
FDR-12FDR-09FDR-14FDR-18 Feeder pillar Light, no contact
Feeder load at switch-on1 overload
FDR-09 · 118 lights47.1 / 50 kVA
Above 90% of rating since 18:05
FDR-12 · 236 lights38.2 / 50 kVA
FDR-14 · 142 lights22.6 / 40 kVA
FDR-18 · 96 lights17.9 / 40 kVA
Pole SL-04127Lit · 40%
Feeder · phaseFDR-12 · Y
Pillar · circuitFP-3 · C2
Zone · wardZone C · Ward 3
Fixture90 W LED, dimmable
ControllerCTL-0921
Feeder meterMTR-20417
Pole9 m, galvanised steel
Registered12 Mar 2023
Reassign feederAsset history
Energy intelligence
Forecasts and findings from 90 days of meter and controller data
7 days30 daysExport findingsEO
Demand forecast, kWh per dayActualForecastRange
Next 7 days11,128 kWh
Forecast peak demand216 kVA Thu 19 Nov, 18:30
Estimated cost71,100
1,5001,6001,700Today1 Nov8 Nov15 Nov21 Nov
Abnormal consumption4 found
MTR-20417Night use 2.4× expected
Investigate
FDR-12 · 6 lightsLit in daylight 07:10–09:30
Photocells
MTR-20388PF falling, now 0.81
Review
FDR-140 kW for 38 min, 13 Nov
Outage
Load pattern by feeder, 2 h slots
FDR-03
FDR-07
FDR-09
FDR-12
FDR-14
FDR-18
0006121824
FDR-09 carries daytime load from a shared supply; the other feeders follow dusk to dawn.
Recommendations5 open
Dim Zone C to 40%, 00:00–04:00
Motion boosts average 3 per street per hour in that window.
est. −310 kWh / monthApply to profile
Move 18 lights from FDR-09 to FDR-12
FDR-09 reaches 94% of rating at switch-on; FDR-12 has headroom.
−6.2 kVA on FDR-09Plan transfer
Replace 4 drivers before failure
SL-04127, SL-04133 and 2 more show rising driver current.
Predicted within 30 daysCreate work orders
Correct power factor on FDR-09
PF averaged 0.86 in October; capacitor bank at FP-5 may be offline.
est. 1,330 / month in chargesInspect FP-5
Switch Zone F on 6 min later
Ambient sensors read above 60 lux at switch-on all this week.
est. −45 kWh / monthApply to profile

Ambient-light and motion or occupancy sensor integration for adaptive brightness, traffic-based adjustment and configurable dimming profiles on compatible fixtures.

Also in Smart Streetlight Management and Smart Metering Platform

  • Streetlight Monitoring

    Live status of every light, ON/OFF tracking by light, group and zone, GIS map views, operating hours, network availability, and fault identification with history.

  • Remote Control & Scheduling

    Switch lights individually, by group or by zone, on configurable schedules or automatically at sunrise and sunset, with emergency lighting and remote dimming for compatible fixtures.

  • Smart Meter Monitoring

    Voltage, current, active and reactive power, power factor, frequency and kWh, with automated and remote meter reading, validation, exception detection, event records and integration with compatible AMI and AMR systems.

  • Maintenance & Work Orders

    Complaints become tickets automatically, assigned to technicians and tracked through repair, with preventive maintenance planning, spare parts records and resolution-time monitoring.

  • Field Mobile App

    Field teams see live equipment status on the map, receive fault notifications, record inspections and work order updates, view service history and identify assets by QR code or asset ID.

  • Dashboards, Alerts & Multi-City Admin

    Dashboards for lights, meters, live consumption, power quality and faults, alerts by app, SMS and email, and role-based administration across organizations, municipalities, wards and zones.

Pricing

Quoted Per Deployment

Smart Streetlight Management and Smart Metering Platform is priced to the scope of each deployment: sites, devices, integrations and the support you need.

Quote for Smart Streetlight Management and Smart Metering Platform

Tell us how many sites and devices you operate and which systems it must connect to, and we will return a scoped quote.

Request a Quote

Related Case Studies

Smart Street Lighting Control Platform
Smart Infrastructure

Smart Street Lighting Control Platform

Central control, monitoring and fault reporting for connected street lights, their field controllers and the gateways between them.
Smart Metering & Utility Operations Dashboard
Smart Infrastructure

Smart Metering & Utility Operations Dashboard

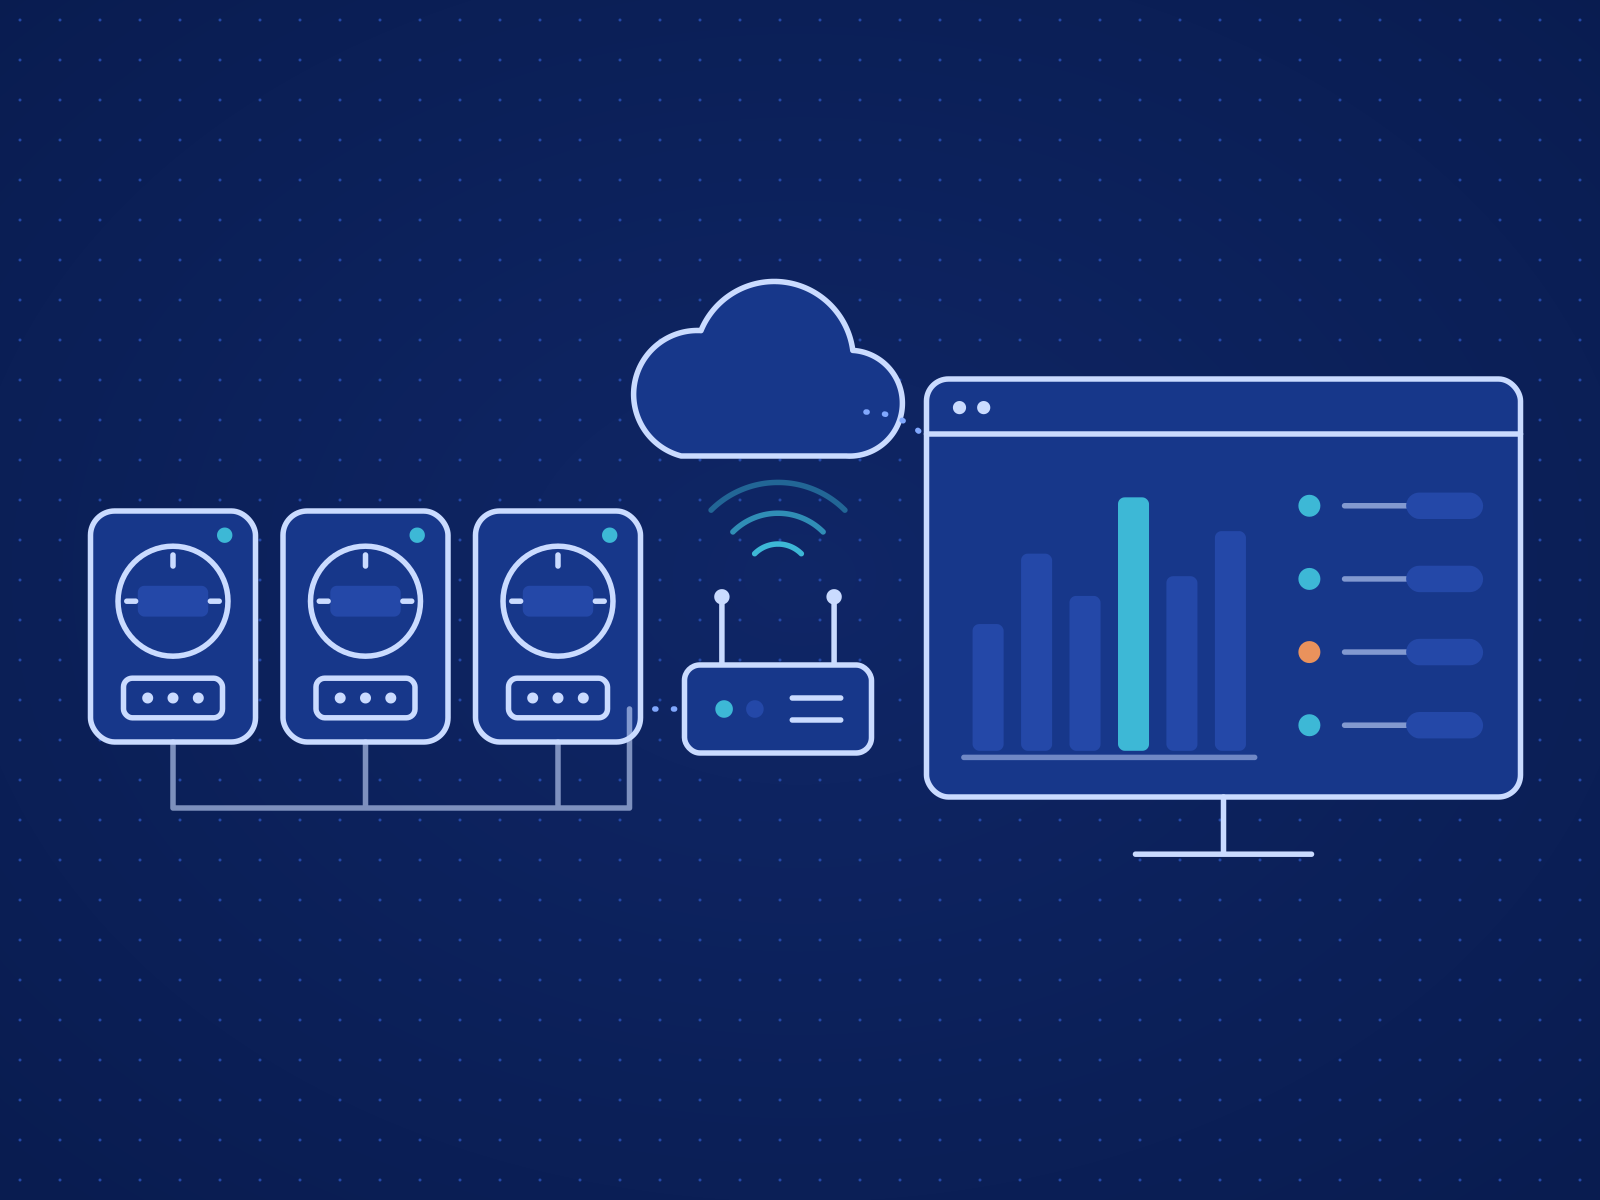
One operations view of meter data and the health of every meter and gateway, for a utility that had relied on manual readings and scattered reports.

Common Questions